Making the Intangible Tangible: How to Measure Focus and Win Stakeholder Arguments
Your team isn't slow - they're distracted. Track focus with simple data, then use it to change the conversation.

Your team isn’t slow. They’re drowning in interruptions.
When stakeholders ask why the timeline slipped, they point at velocity. They talk about “going faster.” They want estimates for when things will “get back on track.”
Meanwhile, your developers face dozens of interruptions getting through an 8-hour day. The research is brutal: Gloria Mark at UC Irvine found it takes 23 minutes and 15 seconds to fully regain focus after a single interruption. Do the math. That’s not a productivity dip. That’s a productivity crater.
But here’s the frustrating part: you already know this. You watch it happen every sprint. The problem? Focus is invisible. There’s no line item for “context-switching tax” in your Jira board. No flow metric captures the meeting that derailed your best engineer’s entire afternoon.
So when leadership - or your Product Owner - asks what went wrong, you’re stuck arguing with opinions. And opinions lose to assumptions every time.
The Hidden Tax You Can’t See (But Can Show)
Context-switching doesn’t just slow things down. It breaks things.
Here’s the math that should terrify every stakeholder: when someone works on two projects, they don’t get 50% on each. They get 40% on each - with a 20% tax lost to switching. Add a third project? Now you’re looking at only 20% productive time per project, with 40% evaporating into the void. Five projects? Productivity can drop by 80%.
Think of it like network bandwidth. Your team isn’t running on 5G - they’re running on 2G with constant packet loss. Every interruption forces a full reconnect. Every context switch drops the connection and starts the handshake over. The signal is there, but the throughput is garbage.
Here’s what changes the game: data doesn’t have an ulterior motive.

I used to argue back when stakeholders complained about timeline slippage. It never worked. Now I don’t wait for the question. I use that data regularly to communicate out - bringing awareness and transparency before anyone has to ask. “Hey, focus is our number one problem. Here’s what the data shows.” They can argue with my opinion. They can’t argue with a trend line. Data forces people to act.
How to Track Focus (Without Micromanaging)
The key? Lightweight. Team-owned. Outcome-focused. This isn’t surveillance. It’s visibility.
The Retro Focus Check-In
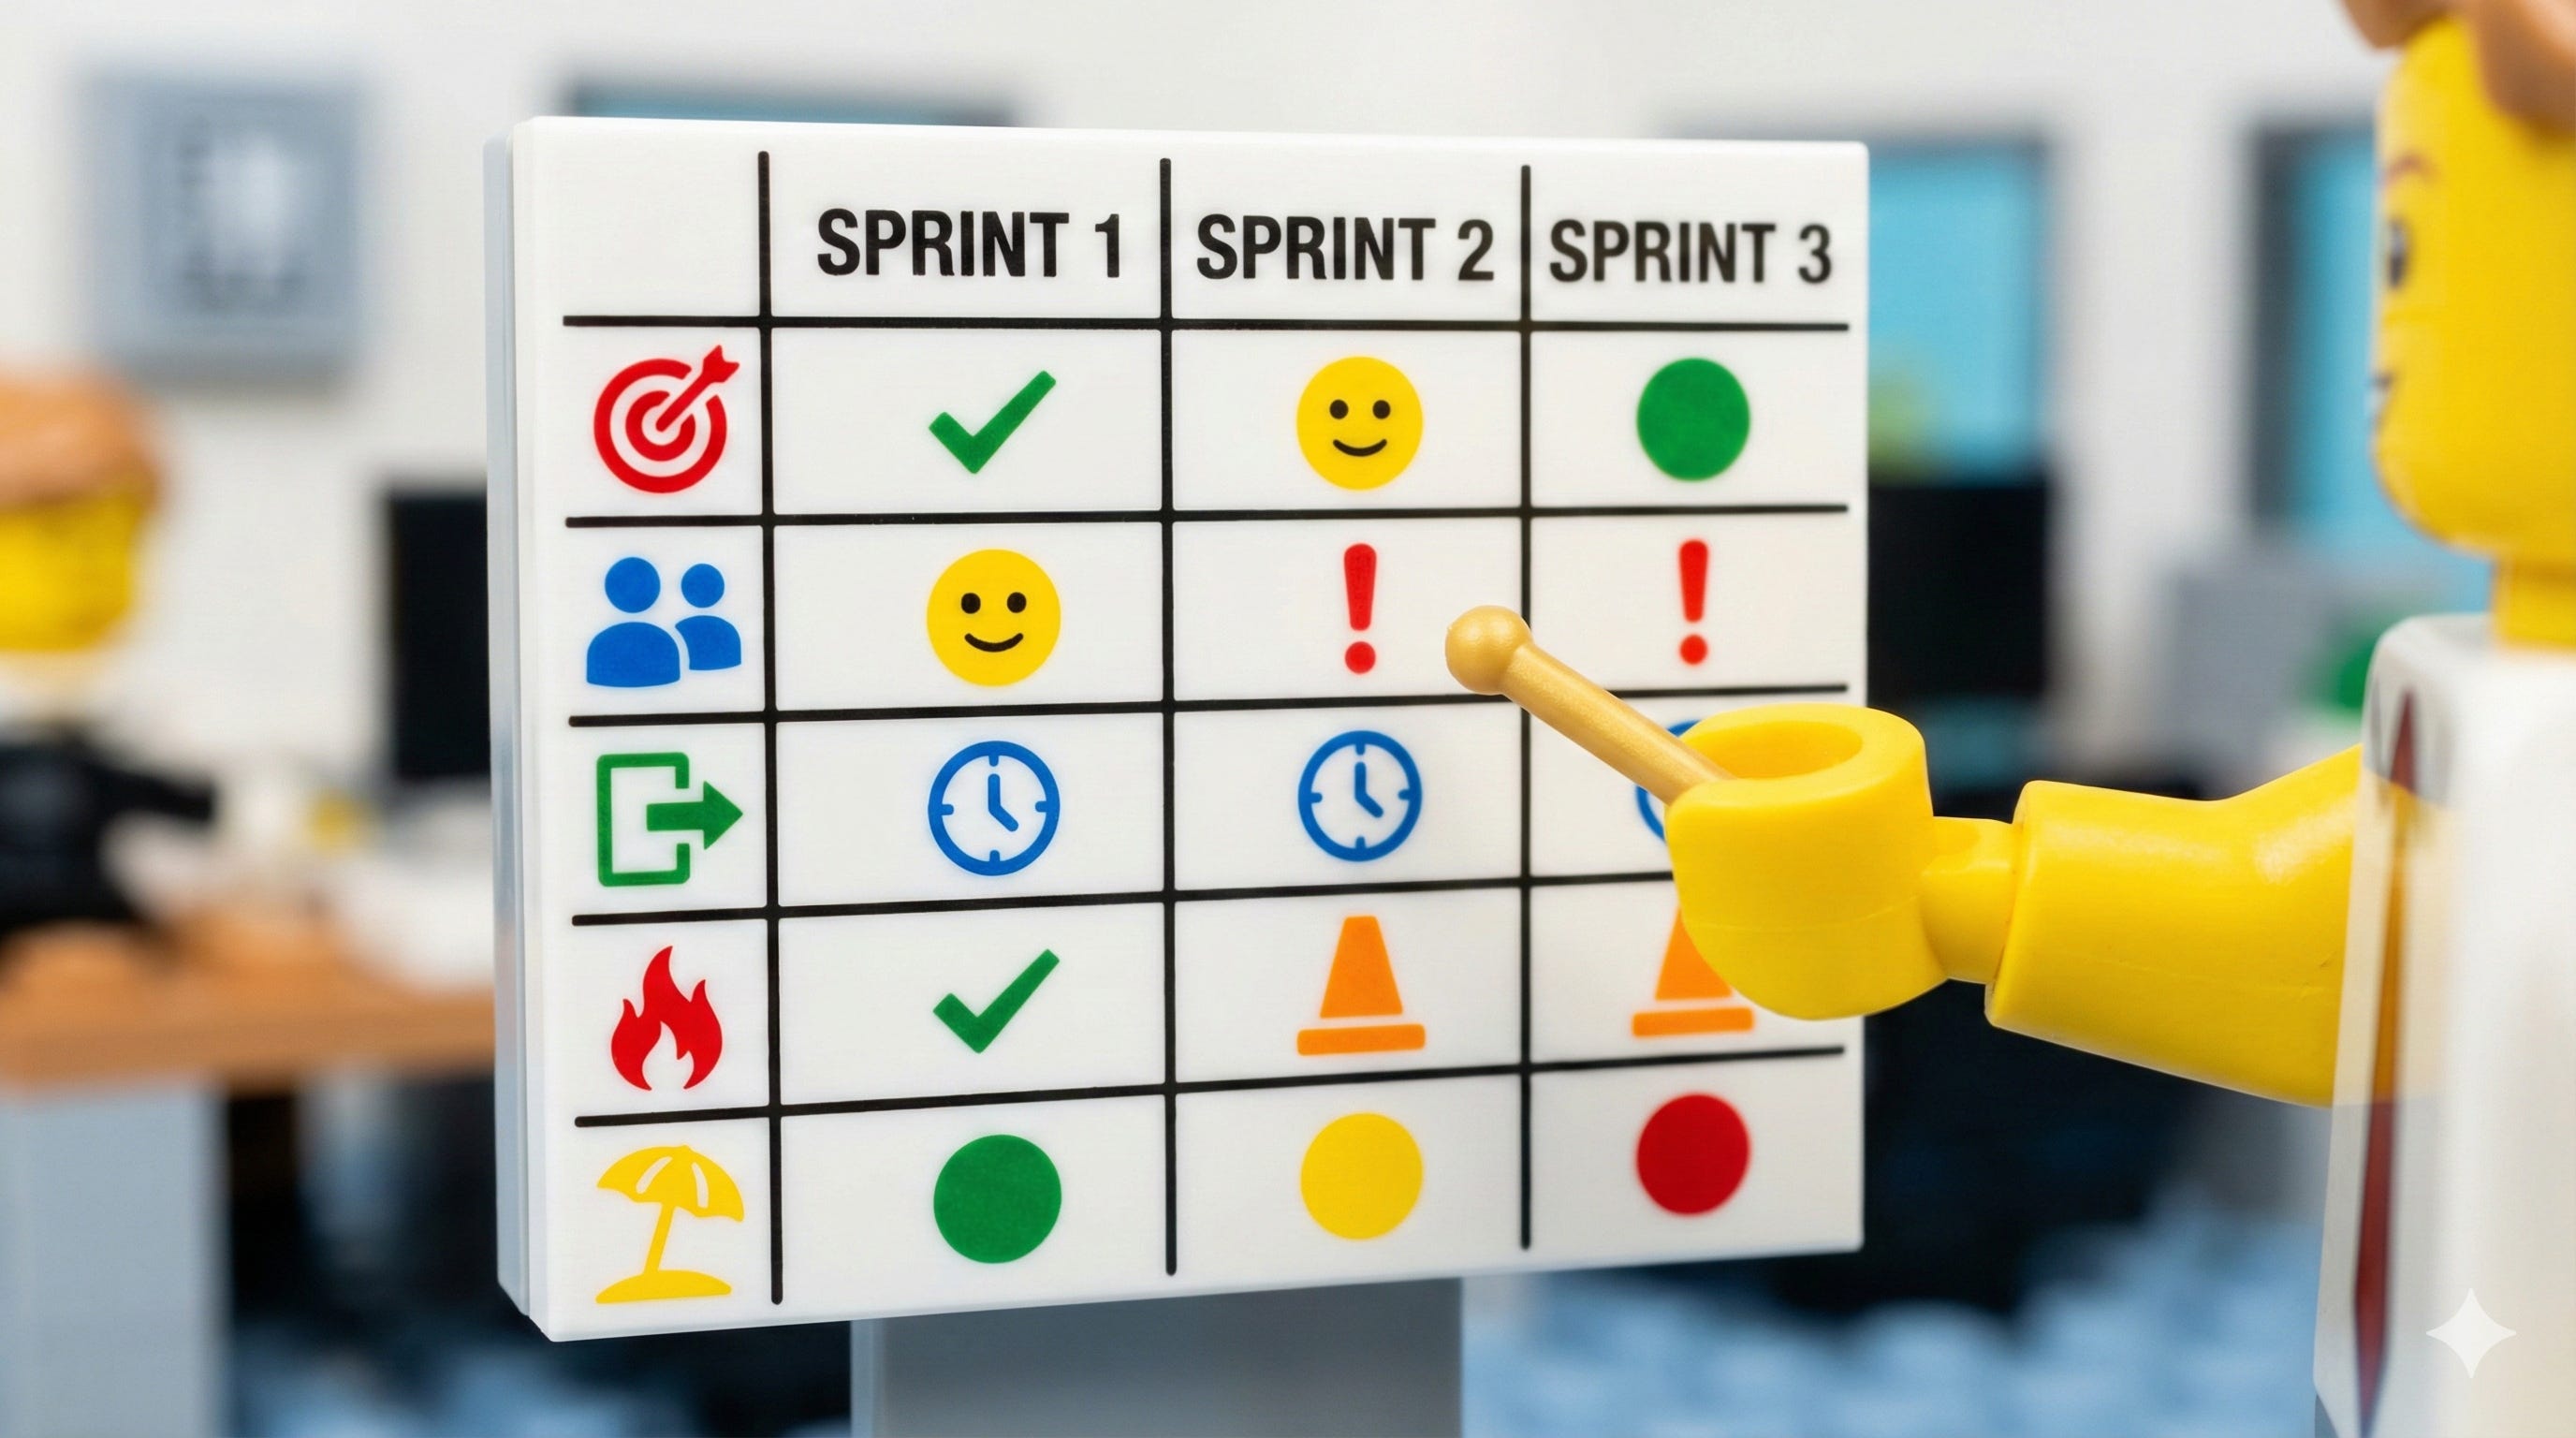
At every retrospective, each team member answers one question: “Where was your focus last sprint?”
Five categories:
- Sprint Goal - Work on committed items
- Team Work - Collaboration, support, internal contributions
- Non-Team Work - Pulled to help other teams, cross-functional requests
- Incidents - Production issues, urgent bugs, firefighting
- PTO - Time off
I use a fun little grid in a Miro board with emojis. Each person drops their breakdown. The beauty of this approach? It’s copyable - you can easily compare sprint over sprint over sprint over sprint. Patterns emerge fast.
Build the Awareness First
After two sprints, you’ll have awareness. After three or more, you’ll have data. Chart it. A simple stacked bar chart showing where focus went, sprint over sprint.
What you’ll see is usually alarming: sprints where 60% of focus went to incidents. Periods where non-team work consumed more time than sprint goal items. Visibility into where focus is actually going - and why that feature slipped.
These insights improve future sprint planning. Your throughput and cycle time should already signal that you need to decrease commitment, but if they aren’t - or if stakeholders are pushing back on “doing less” - this focus data shows why.
Bring It to the Conversation
Next time someone asks “Why is this late?”, don’t defend. Diagnose.
“Look at Sprint 3. The team spent 62% of their focus on incidents and non-team work. We had two major outages and three cross-functional requests that couldn’t wait. This wasn’t a speed problem - it was a focus problem. The question isn’t how we go faster. The question is how we protect the team’s ability to focus.”
That shifts the conversation completely. Now you’re solving the real problem.
Handling the Pushback
Y’all will hit resistance. Anticipate these:
“This feels like micromanaging.”
Good instinct - most tracking tools are micromanagement in disguise. But this isn’t individual monitoring. It’s team-level, self-reported, and the team owns the data. The purpose is to create visibility, not measure productivity. If your team doesn’t see the benefit, don’t do it. (And if they do see it, they’ll want to track it more than you do.)
“People will game the numbers.”
Maybe. But gaming happens when data is used against people. This data doesn’t go in performance reviews. It goes in stakeholder conversations to protect the team. When tracking benefits the team, accuracy follows.
“Stakeholders won’t care about this data.”
Some won’t. At first. But when you show a direct correlation between focus fragmentation and timeline slippage - with dates, percentages, and patterns - the ones who matter will pay attention. Data removes emotion from negotiation. You’re not complaining. You’re reporting.
Make It Stick
The difference between teams that use this and teams that abandon it after three sprints: visibility.
Make focus visible. A dashboard. A wall chart. Something the team sees at every retro. When focus becomes a first-class metric - as visible as throughput or cycle time - it becomes worth protecting.
In my experience, teams who track focus start defending it. It’s about focus, commitment, and visibility into the impact of decisions. The data gives them language and permission to protect their most valuable asset.
And here’s the meta-point: this applies to Scrum Masters too. With so many ideas, so many improvement opportunities, it can be hard for us to focus on the fundamentals. We get pulled in a dozen directions every sprint. And if you’re supporting multiple teams? That context-switching tax hits you harder than anyone. Sometimes the best thing you can do is pick one lever - like focus visibility - and commit to it before chasing the next shiny improvement.
How do you make tangible the intangible? You measure it. You visualize it. You make it impossible to ignore.
Try this next sprint: add a focus check-in to your retro. Five categories. Two minutes. See what shows up.
Stop arguing about speed. Start showing focus.
Continue Your Journey
Monte Carlo Forecasting Calculator: Want to bring more data to your stakeholder conversations? Use probabilistic forecasting to show confidence intervals instead of single-point estimates.
Free Resources Hub: Explore more tools and guides for data-driven agile coaching.